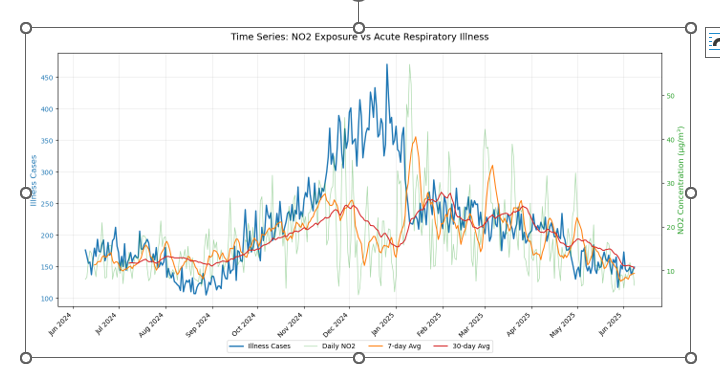
Respiratory Illness analysis with Air Quality Data for UK
Built an end-to-end forecasting framework to quantify and predict daily acute respiratory illness
counts from air quality data. Combined exploratory data analysis with STL seasonal–trend
decomposition to separate strong
winter seasonality and long-term trends from residuals, engineered distributed lag features (1–7
days) to capture delayed exposure effects, and applied
Random Forest, XGBoost, and LSTM models with time-aware validation. SHAP analysis consistently
highlighted PM2.5 and NO2
as dominant predictors, with O3 showing stronger effects in warmer months. Recent case counts
provided short-term
persistence signal, while meteorological variables added limited incremental value once
seasonality and pollution
were modeled.
Skills: LSTM | XGBoost | Feature Engineering |
Data Analysis | Forecasting | Time Series | Early Warning System

Credit Card Default Prediction
I set out to predict credit card defaults using a challenging, imbalanced UCI dataset, building a
Python machine learning pipeline that felt like piecing together a captivating tale. With a
Random Forest model at the heart, I carefully preprocessed the data, tuned the model to handle
the imbalance, and achieved a solid 0.76 ROC-AUC score. Colorful visualizations brought the
data’s story to life. Now, I’m elevating the journey by deploying the model with Flask and
Streamlit for easy access, while adding SHAP and LIME to shine a light on its decision-making,
making the narrative both engaging and transparent for all.
Skills: Python | Machine Learning | Random Forest |
XGBoost | Logistic Regression
Stroke Prediction
I embarked on a mission to predict strokes, harnessing the power of PySpark MLlib to build a
scalable machine learning model that could handle vast health data with ease. The journey began
with meticulous data preprocessing, tackling class imbalance, and evaluating the model to ensure
its reliability. Key health indicators emerged as the story’s heroes, revealing critical
insights. To bring this tale to life, I crafted an interactive Tableau dashboard, painting a
vivid picture of the data’s patterns. This end-to-end adventure showcased my knack for blending
robust ML with compelling visualization, creating a meaningful narrative for better health
outcomes.
Skills: Python | Feature Importance | PySpark |
XGBoost | SMOTE
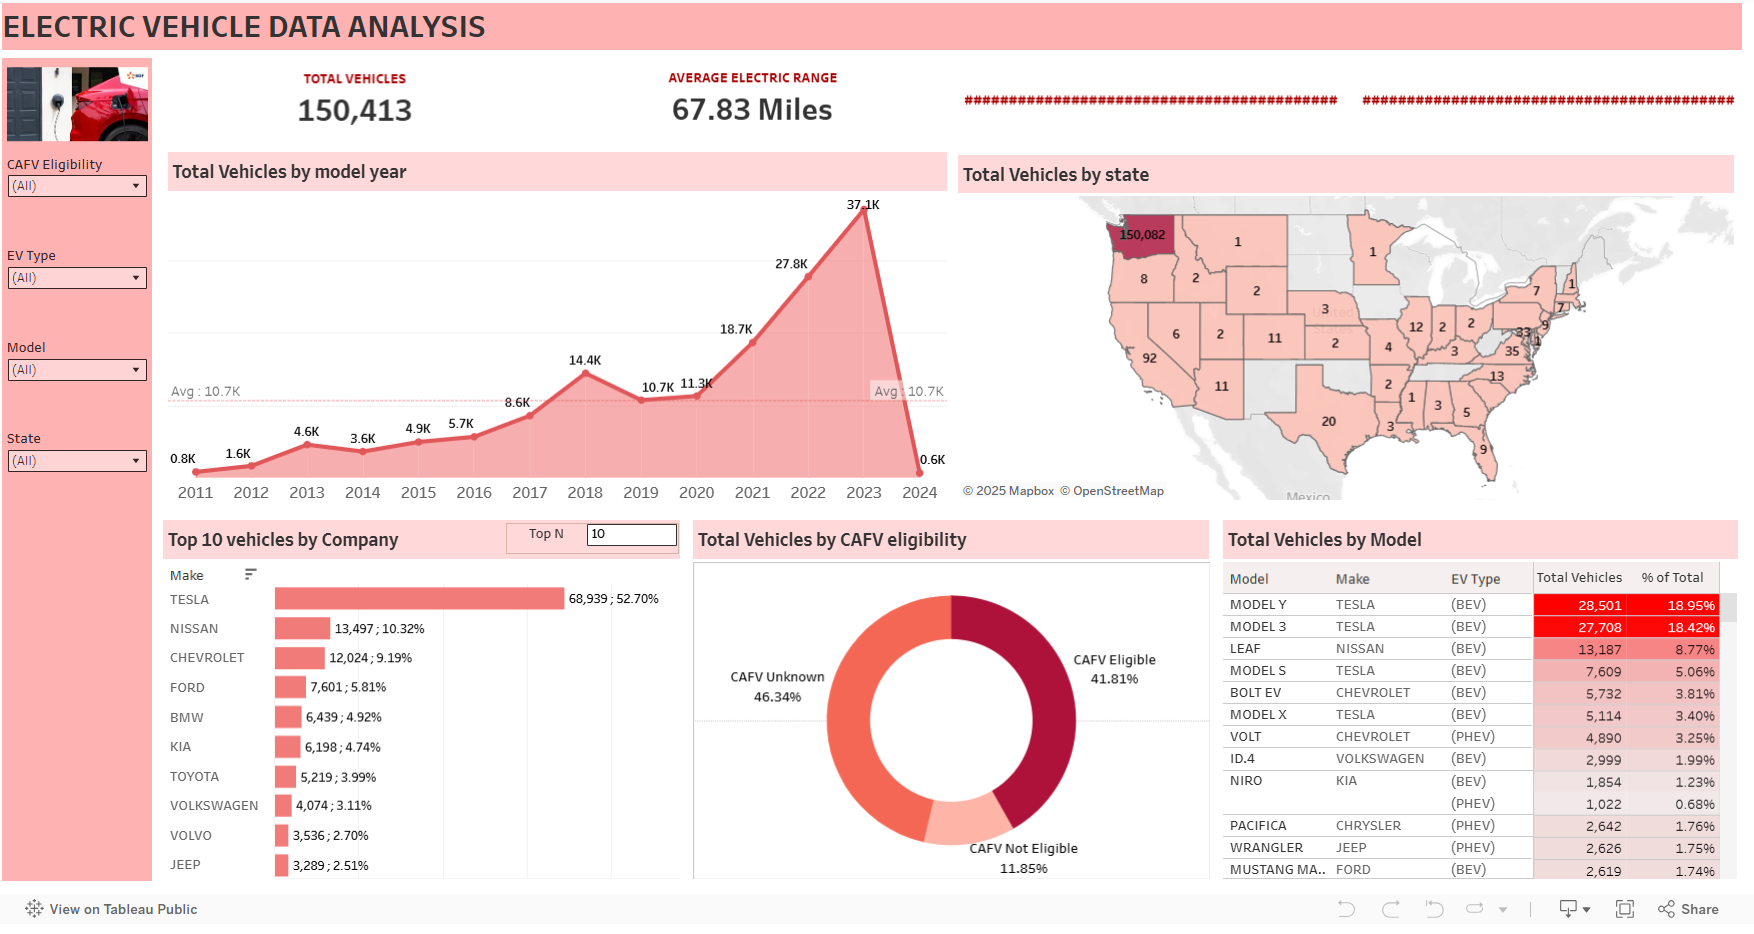
EV Insights Dashboard
I worked with a huge dataset of over 150,000 electric vehicle (EV) records, using SQL and Python
to clean and organize the information so it was ready for Tableau. It felt like getting a giant
canvas ready for painting! Then I built an interactive dashboard with maps and trend charts that
showed how EVs have grown across the U.S. from 2011 to 2024. The visuals made the data easy to
understand, highlighting key trends and popular areas for EV adoption. This project combined
data cleanup and storytelling to explore what’s fueling the rise of electric vehicles.
Skills: Tableau | Dashboard | Data Cleaning |
Data Modelling | KPIs
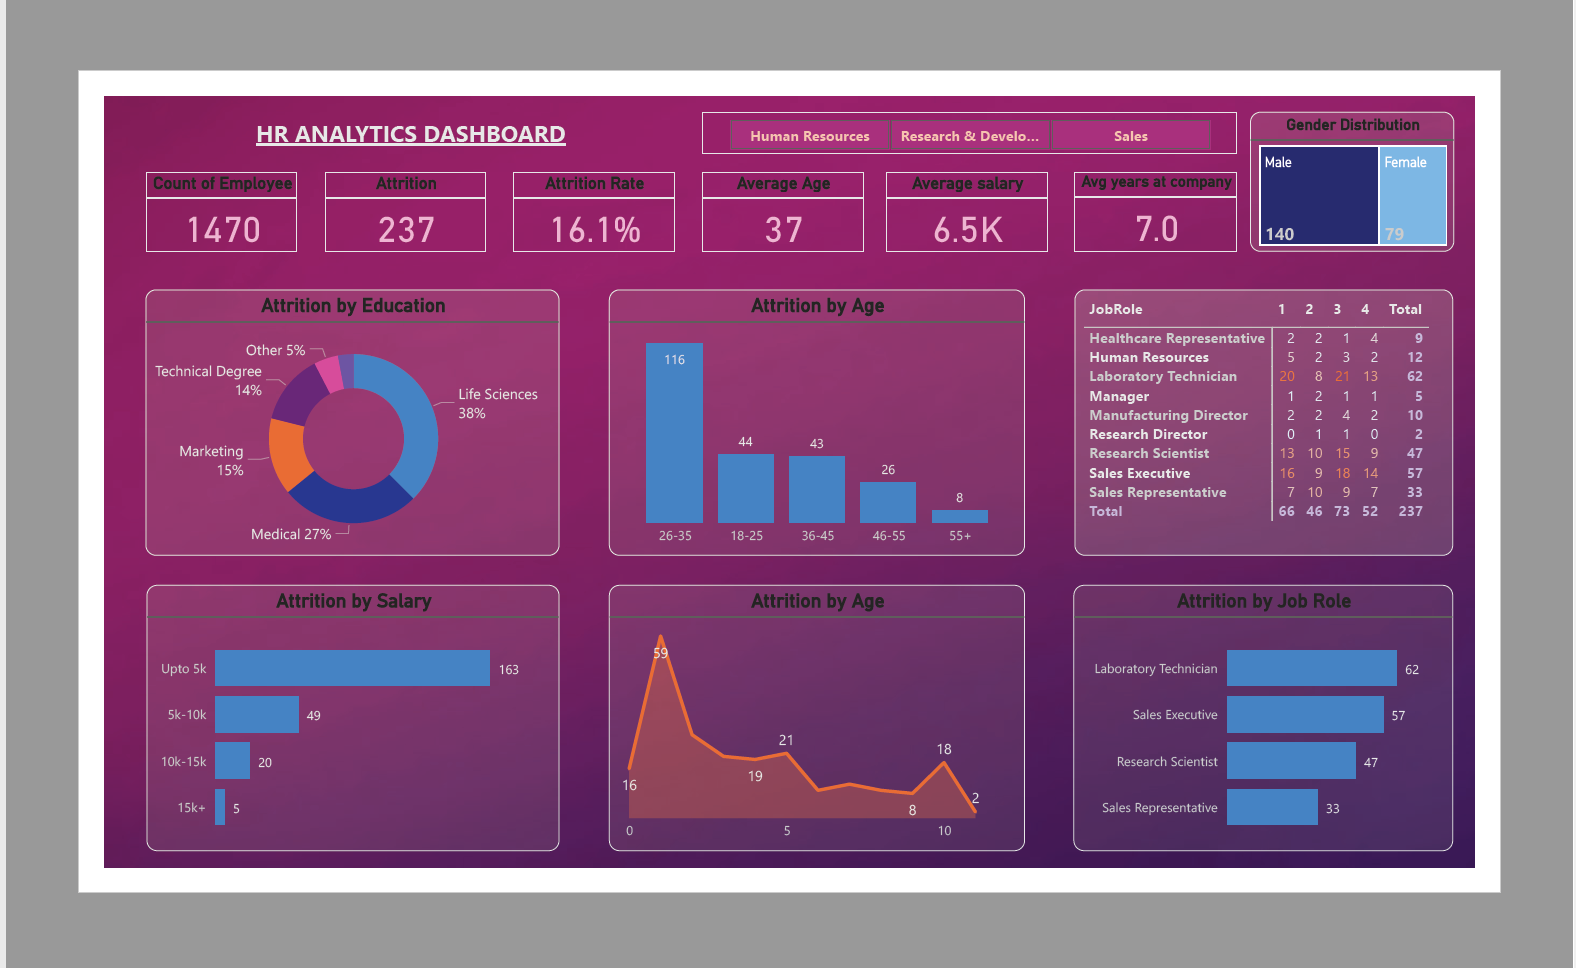
HR Analytics Dashboard
I developed an HR analytics dashboard to explore employee attrition patterns. Using Python, I
cleaned and prepared the data, then visualized it in Tableau with dynamic features like KPIs,
heatmaps, and drill-down filters. The dashboard revealed key drivers such as low job
satisfaction and poor work-life balance, helping stakeholders gain strategic insights and make
data-informed decisions to reduce turnover and improve employee retention.
Skills: Power BI | Dashboard | Data Cleaning |
Data Modelling | KPIs
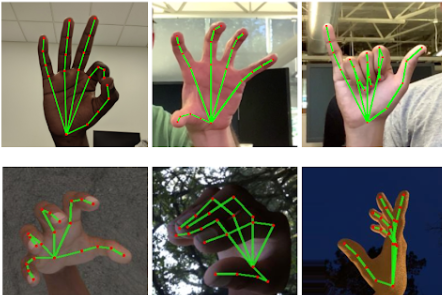
Hand Gesture Detection
I dove into crafting a nifty hand gesture detection model, using TensorFlow’s Object Detection
API with SSD MobileNet v2 to keep it fast and precise. After building it, I converted it to
TFLite for seamless mobile deployment, ideal for real-time use on smartphones. This project was
a fun showcase of my deep learning and computer vision skills, with mean Average Precision (mAP)
to gauge its performance. It demonstrated how AI can thrive on resource-light devices,
delivering lively gesture recognition with efficiency and style, proving that cutting-edge tech
can be both powerful and accessible on the go.
Skills: Python | Labelling | Computer Vision |
Deep Learning